ActivityBar
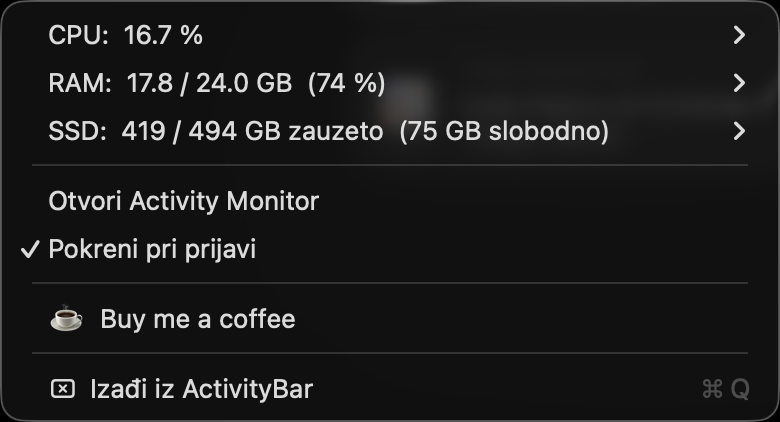
Live CPU, RAM and SSD usage in your macOS menu bar. Native Swift, a 1.2 MB app, zero bloat.
What it does
Activity Monitor makes you switch windows. Bigger paid alternatives ship 200 features you don't need. ActivityBar does one thing: shows you live CPU, RAM and SSD usage in the corner of your screen so you never have to leave your work to check.
- Three numbers, always visible
- Native Swift — no Electron bloat
- A 1.2 MB app, and about 0.2% CPU while it sits there
- Monospaced digits, so the numbers don't jump around as they change
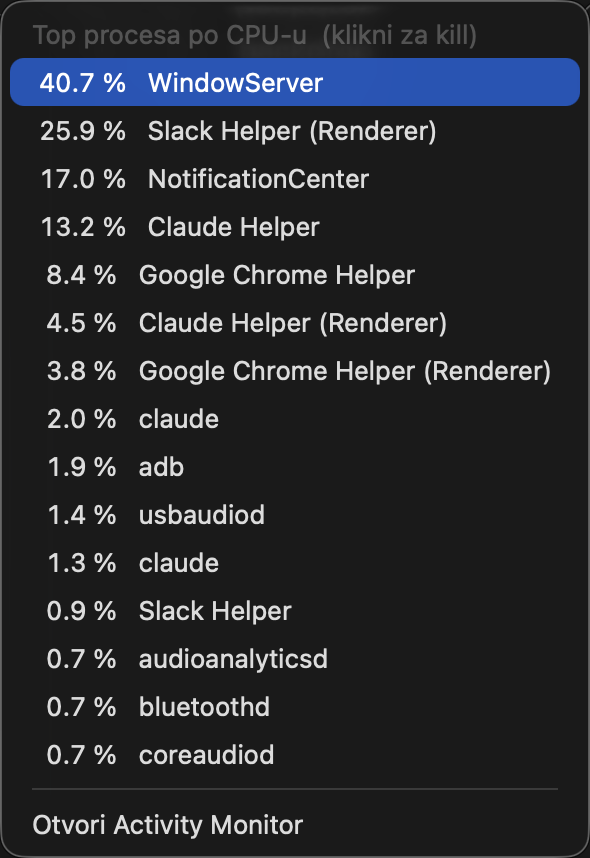
- CPU and RAM open the list of hungriest processes — kill one straight from the menu
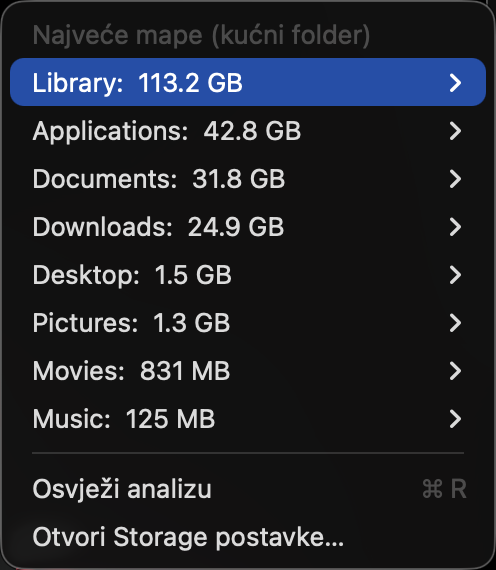
- SSD opens your biggest folders, and keeps drilling until you find what actually filled the disk
- Launch at login, toggled from the menu — still no daemon
Activity Monitor te tjera da napustiš prozor u kojem radiš. Veće plaćene alternative dolaze s 200 značajki koje ti ne trebaju. ActivityBar radi jednu stvar: pokazuje ti CPU, RAM i SSD uživo u kutu ekrana, tako da nikad ne moraš prekidati posao da provjeriš.
- Tri broja, uvijek vidljiva
- Nativni Swift — bez Electron bloata
- Aplikacija od 1,2 MB i oko 0,2% CPU-a dok samo stoji
- Monospace znamenke, da brojevi ne poskakuju dok se mijenjaju
- CPU i RAM otvaraju popis najgladnijih procesa — ubij ga direktno iz menija
- SSD otvara tvoje najveće mape i kopa dalje dok ne nađeš što ti je stvarno pojelo disk
- Pokretanje pri prijavi, uključuje se iz menija — i dalje bez daemona
Screenshots
Why native?
ActivityBar is still a single Swift file — around 850 lines now. It reads Apple's built-in host_statistics and vm_statistics64 syscalls — the same data source the macOS Activity Monitor uses — so the numbers match exactly. Folder sizes come from du, run at background CPU and I/O priority so a scan never gets in the way of what you're doing.
There is no helper process, no background daemon, no Electron runtime, no telemetry, no analytics. It ships as a 1.2 MB .app — a 225 KB binary, the rest is the icon — and has no network code at all. At rest it costs roughly 0.2% CPU — readings are cached, menu labels are only written while the menu is actually open, and the title in the menu bar is only redrawn when the text changes.
Even the app icon is generated programmatically by a separate Swift script — no Photoshop, no Figma export — so the whole build pipeline is one shell script and reproducible on any Mac with the command line tools.
ActivityBar je i dalje jedna Swift datoteka — sad oko 850 linija. Čita Appleove ugrađene host_statistics i vm_statistics64 syscallove — isti izvor podataka koji koristi macOS Activity Monitor — pa se brojevi točno poklapaju. Veličine mapa dolaze iz du, pokrenutog na pozadinskom CPU i I/O prioritetu, da ti skeniranje nikad ne smeta u radu.
Nema pomoćnog procesa, nema pozadinskog daemona, nema Electron runtimea, nema telemetrije, nema analitike. Isporučuje se kao .app od 1,2 MB — binary je 225 KB, ostalo je ikona — i uopće nema mrežnog koda. U mirovanju troši otprilike 0,2% CPU-a — očitanja se keširaju, natpisi u meniju se pišu samo dok je meni stvarno otvoren, a naslov u menu baru se iscrtava samo kad se tekst promijeni.
Čak je i ikona aplikacije generirana programski zasebnom Swift skriptom — bez Photoshopa, bez Figma exporta — pa je cijeli build pipeline jedna shell skripta, reproducibilna na bilo kojem Macu s command line toolsima.
Build story
Updates
August 2026
- The SSD row now opens your largest folders, sorted by size — and every folder opens into its own subfolders, so you can follow the trail down to whatever is actually eating the disk
- CPU and RAM open the top processes by that metric, and you can end one from the menu with a normal quit or a force kill
- Launch at login, toggled from the menu
- Roughly four times lighter at idle, and disk scans now run at background priority so they stay out of your way
May 2026
- First release — live CPU, RAM and SSD in the menu bar
Kolovoz 2026.
- SSD sad otvara tvoje najveće mape, poredane po veličini — a svaka se mapa otvara u svoje podmape, pa možeš pratiti trag do onoga što ti stvarno jede disk
- CPU i RAM otvaraju najgladnije procese po toj mjeri, a proces možeš ugasiti iz menija — normalno ili na silu
- Pokretanje pri prijavi, uključuje se iz menija
- Otprilike četiri puta lakši u mirovanju, a skeniranje diska sad radi na pozadinskom prioritetu pa ti ne smeta
Svibanj 2026.
- Prvo izdanje — CPU, RAM i SSD uživo u menu baru